
Things have been moving so fast we haven’t been able to get this market update out before today.
Primary rates beginning of the year to today:
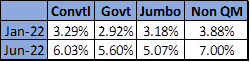
Brutal second quarter for the mortgage market.
Today, origination pipelines are down considerably, margins are being squeezed, margin calls are commonplace, thousands of employees have been laid-off, volatility is spiking, funds are managing redemptions, trades have been repriced or failed, durations continue to extend and there is a buyers strike in the PLS market. As the saying goes, “Other than that Mrs. Lincoln, how was the play?”
The Fed wants to slow down inflation and intimated they could raise rates in the next seven meetings and have done so in 3 out of 3 with the most recent an unprecedented 75bps. Are we almost halfway there? Who knows, but the 10 year does not seem to want to break 3.00%
Where does all this leave us? Many mortgage bankers are shifting to best efforts from mandatory delivery, yields have hit a level I wish my stockbroker could achieve, and the whole loan market is flooded with opportunities we have not seen since 2010.
We have clearly transitioned from a sellers’ market to a buyers’ market. Levered buyers are on the sidelines and with buyer yield requirements increasing from 7% into the double digits. We’re at yields that have historically proven to work out well.
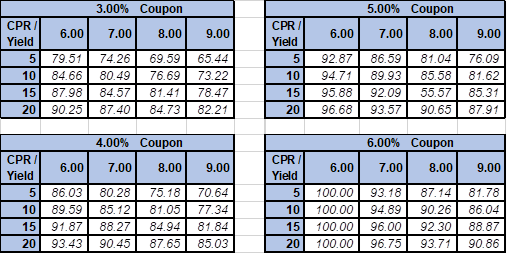
Below tables show the change in price at different fixed interest rates, prepayment (CPR) speeds and yields:
We constantly hear about rising rates impacting mortgage payments and/or that homeowners with 3% mortgages will never prepay.
Although rising rates will not change anything on a borrowers conforming 30-year fixed rate mortgage, the table below shows what could happen to future home prices when solving for a consistent mortgage payment:
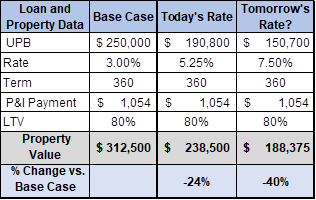
We are not predicting a 40% decrease in home prices, but home affordability warrants consideration. We also think models are overestimating slower speeds. Regardless of rates, homeowners still pay off when they move up, move down, have babies, divorce, or just need cash. Furthermore, baby boomers are about to downsize in mass, and this will impact prepayment’s as well.
Non-QM
The Non-QM market has been in shambles, dragging everyone down together. Investors and aggregators have felt the pain caused by extended durations while originators struggle to right size current coupon and find any liquidity, in this fast-moving market.
The PLS market (execution of choice for this sector) is experiencing a buyers strike leading to wider spreads and much higher rates. We started 2022 with AAA spreads around +150 and the 10-year at 1.63% and now we are around +235 spread with a 2.90% 10-year. This combination of factors took the par coupon from 3.875% to where it feels like we have settled in around 7.00% and 7.375% for DSCR.
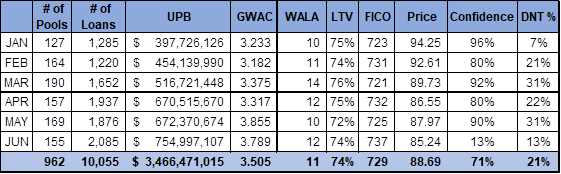
Below is a month-to-month snapshot of the Non-QM/DSCR market from January thru June 2022:
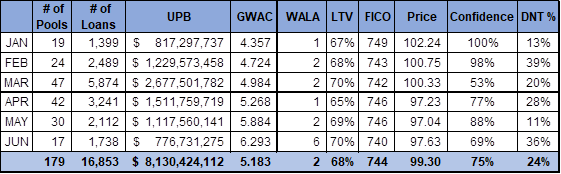
**Confidence Quotient is the percentage of sellers that have accepted RAMS’ bid or communicated to us what they are doing with the subject loans.
Scratch & Dent
In our view, the scratch & dent loan sector is currently pricing cheapest in the residential loan market. Levered buyers had dominated this part of the market. Yields for scratch & dent loans, using reasonable prepay speeds, are in the high single digits, unlevered, and well into the double digits if the borrower pays off early.
Pricing has been hit hard due to duration concerns and rates are lower than current market since the S&D sector is generally selling ~12-month-old production, once it has been put back to the originator. However, we believe investors are using overly conservative prepay assumptions (see highlighted statement above). Production is down significantly, and we believe yields will improve due to a supply scarcity once we get through this storm.
Many sellers are not ready to accept today’s lower price levels, but the current ebb and flow of liquidity allows investors to be more selective and targeted than in more orderly times.
Below is a month-to-month snapshot of the S&D market from January thru June 2022:
**Confidence Quotient is the percentage of sellers that have accepted RAMS’ bid or communicated to us what they are doing with the subject loans.
Remember, this product was intended to go into agency MBS securities, so the average LTV and FICO is pretty consistent. What you will notice is the coupon is increasing while the price is decreasing. Color (aka pricing feedback) is what we are trying to share in this letter. Unfortunately, sellers are not quick to react in this sector due to the discounted prices and loss and/or view there may be other options. We appreciate, buyers investing their time and energy in bidding for loans, so we will continue to request color and feedback from sellers.
We currently have 81 pools with 1,165 loans and $390mm in UPB for the bid. Call us for offerings.
Jumbos
The Jumbo market has experienced some damage but not as severe as the Non-QM sector. There were some banks that could not get their PLS deals off in time before rates rose and spreads gapped out. Jumbo PLS issuance is dominated by Primary Broker Dealers. They can react quicker to volatile markets and are better positioned to hedge both the rate and spread risk while aggregating jumbo product. Many independent mortgage banks sell their jumbo on a best-efforts basis, so it limited the damage and hedge losses experienced by the larger aggregators and issuers.
A recent JP Morgan deal with a 3.0% coupon with senior AAA’s at 4-16/32 back of TBAs priced in the high 80s. We sold $100mm just inside of a 5.50% yield.
Bridge, Fix & Flip
This sector has taken a similar beating with a lack of liquidity (one recent PLS deal received no “indications of interest”) and a few originators have halted fundings.
As we have been touting, bridge loans offer a high return with much shorter duration (2yr terms in general). Prior to this run up in interest rates, bridge loans were typically sold at par with a passthrough rate of between 5.5% and 7.0% on a servicing retained basis. Today, that rate has risen to 8.5% or greater and loans are being sold on a servicing released basis.
If you are a residential non-performing loan buyer, you might want to consider buying performing bridge loans. Unlike a 30 year, 3% interest rate NPL, where there is material risk of the loans re-performing and the extension of a 3% yielding asset, bridge loans have short maturities, usually 2 years or less. If a performing bridge loan defaults, or does not pay-off at maturity, many have default interest rates that range between 18% and 25%. If you are adept at managing REO, you should be comfortable taking over a rehab project in the event of default because the resulting return, can be a much greater. This a great sector for investors limited by geography as you can pick the locations you like.
We currently have nine pools offered with properties located across the nation for >$200mm.
EBOs/NPLs
EBOs
This trade has run its course until/if delinquencies rise. Pricing has dropped alongside with G2 TBAs and lower reperformance projections. With the rise in primary rates, it is cheaper to finance these loans in the MBS security than to buy them out and finance them on a warehouse line.
NPLs
NPL sales are still not prevalent, and the lack of supply has helped this sector avoid the drubbing taken in other sectors, although we may have passed its peak pricing. We are watching closely how borrowers coming out of COVID forbearance plans are going to perform as this could increase supply – perhaps dramatically. We also know refinancing to avoid a pending default is much tougher now than just a few months ago.
NPLs are trading to a lower discount rate than used by consistent buyers of performing and re-performing loans. There are two primary reasons for this. First, buyers of NPLs are more confident about the duration of their investment assuming a foreclosure sale followed by REO liquidation outcome. Second, some investors have a maximum holding period of between 3 and 7 years. Therefore, investments with durations beyond the holding period require a projected exit price, which today is relatively low vs. 3 months ago.
Geography remains a major focus of NPL buyers. Southern states, especially Texas and Florida are preferred. New York, especially Southern New York, for many buyers is a non-starter. Many buyers still have 2004 to 2008 vintage NY NPLs in their portfolios and do not want to buy more. California, which not too long ago, was considered a relatively fast foreclosure state is becoming an issue for some buyers, especially buyers of super jumbo NPLs where borrowers have become adept at fighting eviction following foreclosure sale.
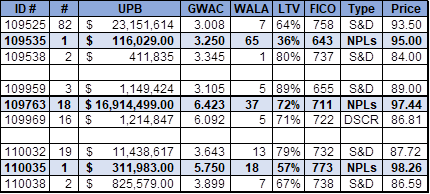
Interesting current market fact. Loans with comparable coupons and characteristics – one performing and one NPL. Which loan has a higher price as a % of UPB? The NPL.
Below are examples of recent trades reflecting this phenomenon:
Something to think about:
How many home buyers bought because of low rates with the sole intent of selling as home prices continued to rise. How many do not have a long-term view and will sell or go into foreclosure? We will see.
We leave you with this inspirational quote:
“You never know how strong you are until being strong is the only choice you have.” – Bob Marley